# filter.py mit Gaußfilter, Boxfilter und Medianfilter
# (C) WiSi 2021
#letzte Änderung 14.10.2021
import numpy as np
import cv2
Magenta = (147, 20, 255)
Yellow = (0, 255, 255)
GREEN = (20, 255, 20,)
BLUE = (255, 0, 0)
WHITE = (200, 200, 200)
RED = (0, 0, 255)
flaeche = np.zeros((1000), np.single)
fflaeche = np.zeros((1000), np.single)
anzahl = np.zeros((1000), np.uint32)
fanzahl = np.zeros((1000), np.single)
izeit = np.zeros((1000), np.uint32)
temp = np.zeros((13), np.uint32)
sorted_temp = np.zeros((13), np.uint32)
ftemp = np.zeros((13), np.single)
fsorted_temp = np.zeros((13), np.single)
# Beschriftung kommt noch
################################## Gaußfilter ########################################################
# Gaußkurve testen und Koeffizienten ausgeben
gauss_summe = 0
for i in range (-5, 6):
# -5 -4 -3 -2 -1 0 1 2 3 4 5
x = i / 2.7
y = np.exp(-x*x/2.0) / np.sqrt(2.0*np.pi) / 0.4
gauss_summe = gauss_summe + y
print ("{:8.4f}".format(y))
print()
print ("{:8.4f}".format(gauss_summe))
bg = np.zeros((550, 1900, 3), np.uint8) # Result Screen aufmachen
cv2.line(bg,(1,1),(1,500),(WHITE),2) # Y-Skala
cv2.line(bg,(1,499),(1900,499), WHITE,2) # X-Skala
for j in range (1,5):
cv2.line(bg,(0, j * 100),(15, j * 100), WHITE,2) # Y- Ticks
for j in range (1,11):
cv2.line(bg,(j * 120, 500),(j * 120, 515), WHITE, 2) # X- Ticks
for j in range (1,21):
cv2.line(bg,(j * 60, 500),(j * 60, 510), WHITE, 1) # X- Ticks
file1 = open('1-10-Oktober.txt', 'r') # Datensatz einlesen
Lines = file1.readlines()
count = 0
for line in Lines:
position = line.find("UTC")
# Hier habe ich die Positionen abgelesen
# 06 UTC Anz 32 Fl 28592.5 Fl/Anz 893.52
# 12345678901234567890123456789012345678901234567890
if position > 0:
count +=1
zeit = line[position-3:position-1]
anz = line[position+11:position+15]
fla = line[position+20:position+30]
# print(' Count ', count, ' z ',zeit, ' anz ', int(anz), ' fla ', float(fla))
flaeche[count] = float(fla)
anzahl[count] = int(anz)
izeit[count] = int(zeit)
cv2.circle(bg, (count * 5 , 300 - anzahl[count]*5), 2 , Yellow, -1) # Originalwerte plotten
cv2.circle(bg, (count * 5 , 500 - int(flaeche[count]/200)), 2 , RED, -1)
print (' Anzahl: ',count)
for i in range (6, count-5): # Filtern und plotten
summe = 0
for j in range (-5, 6):
# -5 -4 -3 -2 -1 0 1 2 3 4 5
x = j / 2.7
y = np.exp(-x*x/2.0) / np.sqrt(2.0*np.pi) / 0.4
y = y * anzahl[i+j]
summe = summe + y
fanzahl[i] = summe / gauss_summe # wurde oben beim Test berechnet
for i in range (1, count):
cv2.circle(bg, (i * 5 , 300 - int(fanzahl[i]*5)), 2 , GREEN, -1)
# print (fanzahl[i])
for i in range (6, count-5):
summe = 0
for j in range (-5, 6):
x = j / 2.7
y = np.exp(-x*x/2.0) / np.sqrt(2.0*np.pi) / 0.4
y = y * flaeche[i+j]
summe = summe + y
fflaeche[i] = summe / gauss_summe # wurde oben beim Test berechnet
for i in range (1, count):
cv2.circle(bg, (i * 5 , 500 - int(fflaeche[i]/200)), 2 , Magenta, -1)
# print (fanzahl[i])
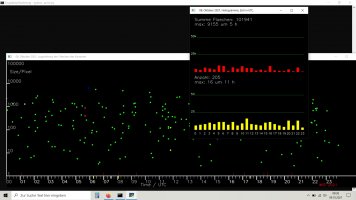
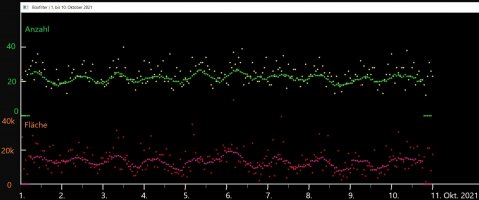
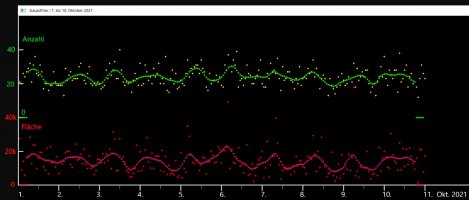
cv2.imshow(' Gaussfilter | 1. bis 10. Oktober 2021', bg)
cv2.waitKey(0) # Auf Tastendruck gehts weiter
cv2.destroyAllWindows()
################################## Boxfilter ########################################################
bg = np.zeros((550, 1900, 3), np.uint8) # Result Screen aufmachen
cv2.line(bg,(1,1),(1,500),(WHITE),2) # Y-Skala
cv2.line(bg,(1,499),(1900,499), WHITE,2) # X-Skala
for j in range (1,5):
cv2.line(bg,(0, j * 100),(15, j * 100), WHITE,2) # Y- Ticks
for j in range (1,11):
cv2.line(bg,(j * 120, 500),(j * 120, 515), WHITE, 2) # X- Ticks
for j in range (1,21):
cv2.line(bg,(j * 60, 500),(j * 60, 510), WHITE, 1) # X- Ticks
file1 = open('1-10-Oktober.txt', 'r') # Datensatz einlesen
Lines = file1.readlines()
count = 0
for line in Lines:
position = line.find("UTC")
# Hier habe ich die Positionen abgelesen
# 06 UTC Anz 32 Fl 28592.5 Fl/Anz 893.52
# 12345678901234567890123456789012345678901234567890
if position > 0:
count +=1
zeit = line[position-3:position-1]
anz = line[position+11:position+15]
fla = line[position+20:position+30]
# print(' Count ', count, ' z ',zeit, ' anz ', int(anz), ' fla ', float(fla))
flaeche[count] = float(fla)
anzahl[count] = int(anz)
izeit[count] = int(zeit)
cv2.circle(bg, (count * 5 , 300 - anzahl[count]*5), 2 , Yellow, -1) # Originalwerte plotten
cv2.circle(bg, (count * 5 , 500 - int(flaeche[count]/200)), 2 , RED, -1)
print (' Anzahl: ',count)
for i in range (6, count-5): # Filtern und plotten
summe = 0
for j in range (-5, 6):
# -5 -4 -3 -2 -1 0 1 2 3 4 5
summe = summe + anzahl[i+j]
fanzahl[i] = summe / 11
for i in range (1, count):
cv2.circle(bg, (i * 5 , 300 - int(fanzahl[i]*5)), 2 , GREEN, -1)
# print (fanzahl[i])
for i in range (6, count-5):
summe = 0
for j in range (-5, 6):
summe = summe + flaeche[i+j]
fflaeche[i] = summe / 11
for i in range (1, count):
cv2.circle(bg, (i * 5 , 500 - int(fflaeche[i]/200)), 2 , Magenta, -1)
# print (fanzahl[i])
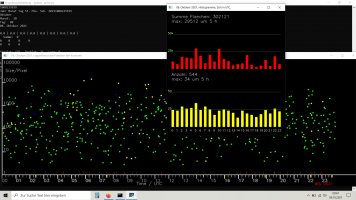
cv2.imshow(' Boxfilter | 1. bis 10. Oktober 2021', bg)
cv2.waitKey(0) # Auf Tastendruck gehts weiter
cv2.destroyAllWindows()
########################## Medianfilter ####################################
bg = np.zeros((550, 1900, 3), np.uint8) # Result Screen
cv2.line(bg,(1,1),(1,500),(WHITE),2) # Y-Skala
cv2.line(bg,(1,499),(1900,499), WHITE,2) # X-Skala
for j in range (1,5):
cv2.line(bg,(0, j * 100),(15, j * 100), WHITE,2) # Y- Ticks
for j in range (1,11):
cv2.line(bg,(j * 120, 500),(j * 120, 515), WHITE, 2) # X- Ticks
for j in range (1,21):
cv2.line(bg,(j * 60, 500),(j * 60, 510), WHITE, 1) # X- Ticks
file1 = open('1-10-Oktober.txt', 'r') # Datensatz noch mal einlesen
Lines = file1.readlines()
count = 0
for line in Lines:
position = line.find("UTC")
# Hier habe ich die Positionen abgelesen
# 06 UTC Anz 32 Fl 28592.5 Fl/Anz 893.52
# 12345678901234567890123456789012345678901234567890
if position > 0:
count +=1
zeit = line[position-3:position-1]
anz = line[position+11:position+15]
fla = line[position+20:position+30]
# print(' Count ', count, ' z ',zeit, ' anz ', int(anz), ' fla ', float(fla))
flaeche[count] = float(fla)
anzahl[count] = int(anz)
izeit[count] = int(zeit)
cv2.circle(bg, (count * 5 , 300 - anzahl[count]*5), 2 , Yellow, -1) # Originalwerte plotten
cv2.circle(bg, (count * 5 , 500 - int(flaeche[count]/200)), 2 , RED, -1)
print (' Anzahl: ',count)
for i in range (6, count-5): # Filtern und plotten
for j in range (-5, 6):
# -5 -4 -3 -2 -1 0 1 2 3 4 5
temp[j+6] = anzahl[i+j]
sorted_temp = np.sort(temp, kind='quick sort')
# print(' Original ', temp)
# print(' sortiert ', sorted_temp)
# print(' Resultat ', sorted_temp[7])
cv2.circle(bg, (i * 5 , 300 - sorted_temp[7]*5), 2 , GREEN, -1)
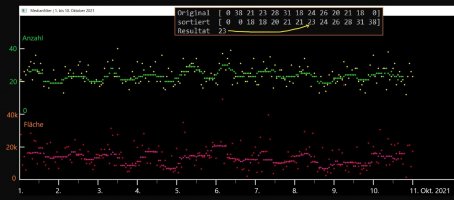
# Original [ 0 28 15 38 21 23 28 31 18 24 26 20 0]
# sortiert [ 0 0 15 18 20 21 23 24 26 28 28 31 38]
# Resultat 24 sorted_temp[7] ^ ist die Mitte der 11
for i in range (6, count-5):
for j in range (-5, 6):
ftemp[j+6] = flaeche[i+j]
fsorted_temp = np.sort(ftemp, kind='quick sort')
cv2.circle(bg, (i * 5 , 500 - int(fsorted_temp[7]/200)), 2 , Magenta, -1)
cv2.imshow(' Medianfilter | 1. bis 10. Oktober 2021', bg)
cv2.waitKey(0)
cv2.destroyAllWindows()
################ EOF WiSi 2021
 www5f.biglobe.ne.jp
findet man die 2021 Aurigiden Radio Ergebnisse aus Japan.
www5f.biglobe.ne.jp
findet man die 2021 Aurigiden Radio Ergebnisse aus Japan.
 de.wikipedia.org